Stream temperature, Stream Flow, and Gage Height

Welcome back to part 3 in my USGS stream conditions series. In the first two posts we talked about what the USGS stream conditions site was and how to access this information. We also discussed how to interpret the broad national and state maps and how to find a specific station. Now it is time to discuss the individual graphs and how to read them.
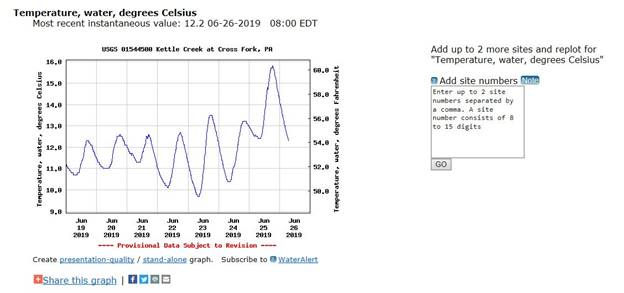
The first one we will discuss is the temperature graph. This graph displays the water temperature in both Celsius and Fahrenheit. There are a couple of reasons that it is important to know the stream temperature. Your safety and the safety of everyone in your party should be the most important factor when planning a trip and knowing the water temperature is extremely important to keeping yourself and others safe. Fisherman can also benefit from knowing the water temperature prior to leaving for a trip. Temperature has a huge impact on a fish’s behavior as well the behavior of their food sources like insects.
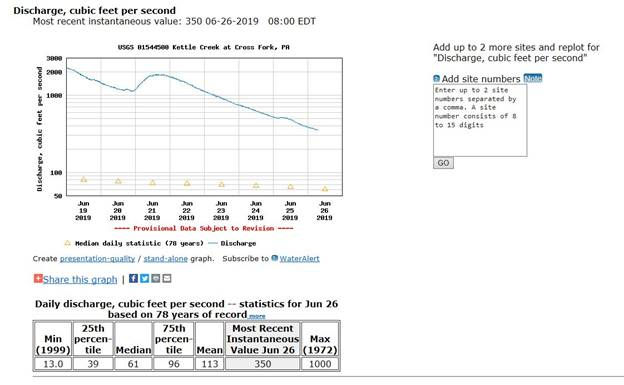
This graph shows the stream flow or discharge. Discharge is defined as the volume of water flowing past a given point in a given amount of time. This is reported in cubic feet per second on this graph. You can tell by analyzing the graph that the stream flow has been gradually going down for this 7 day period. This also shows statistics for this parameter to allow you compare the current conditions with historical data. The mean (average) is 113 cubic feet per second and when we compare it to the most recent value of 350 cubic feet per we can see that this stream is flowing 3 times faster than the average. When we see this type of variance from the average we definitely want to proceed with caution. Stream discharge is the best indicator of current stream conditions along the entire length of the waterway.
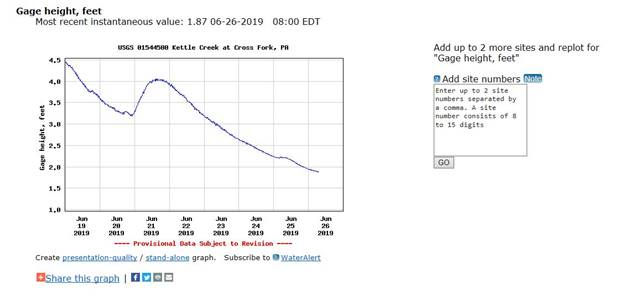
This graph shows the gage height at the station. Now gage height is not how deep the stream is nor does it correlate to the depth of the stream at any other point along the waterway. This is simply a reference point at this specific station. It is an elevation point on a gage at the station to give a relative indicator as to how high the water has risen or fallen at that station. In this case you can see where it has been gradually falling for the last week.
By reviewing this data before leaving for your trip you will have a good idea of what is happening on the waterway and can be better prepared for its conditions. Another point I would like to make is that it is a good idea to record this information in a book for a given stream. When you have a great day on the water record these details as to the discharge, water temp, and gage height and then plan your trips around these parameters to get the most out of your time.
I hope you found this information useful now start diving into this data for all your favorite streams. I will be continuing this series on the other parameters that track water quality in the days to come. In the meantime keep your gear dry and lines tight.
Commentaires